spatial demographics
the demographic fall
The 6-month exhibition The demographic fall makes demography tangible in all its dimensions. The exhibition also asks visitors how demographic developments will change our society and the way we live together in the future.
Role
Designer
Date
2024
target group
Cross-generational
The exhibition is aimed at everyone who is part of the demographic shift. It is suitable both for individuals experienced in working with demographic data and for those exploring the topic of demographics for the very first time.
Key Visual
Natural Processes meet statistics
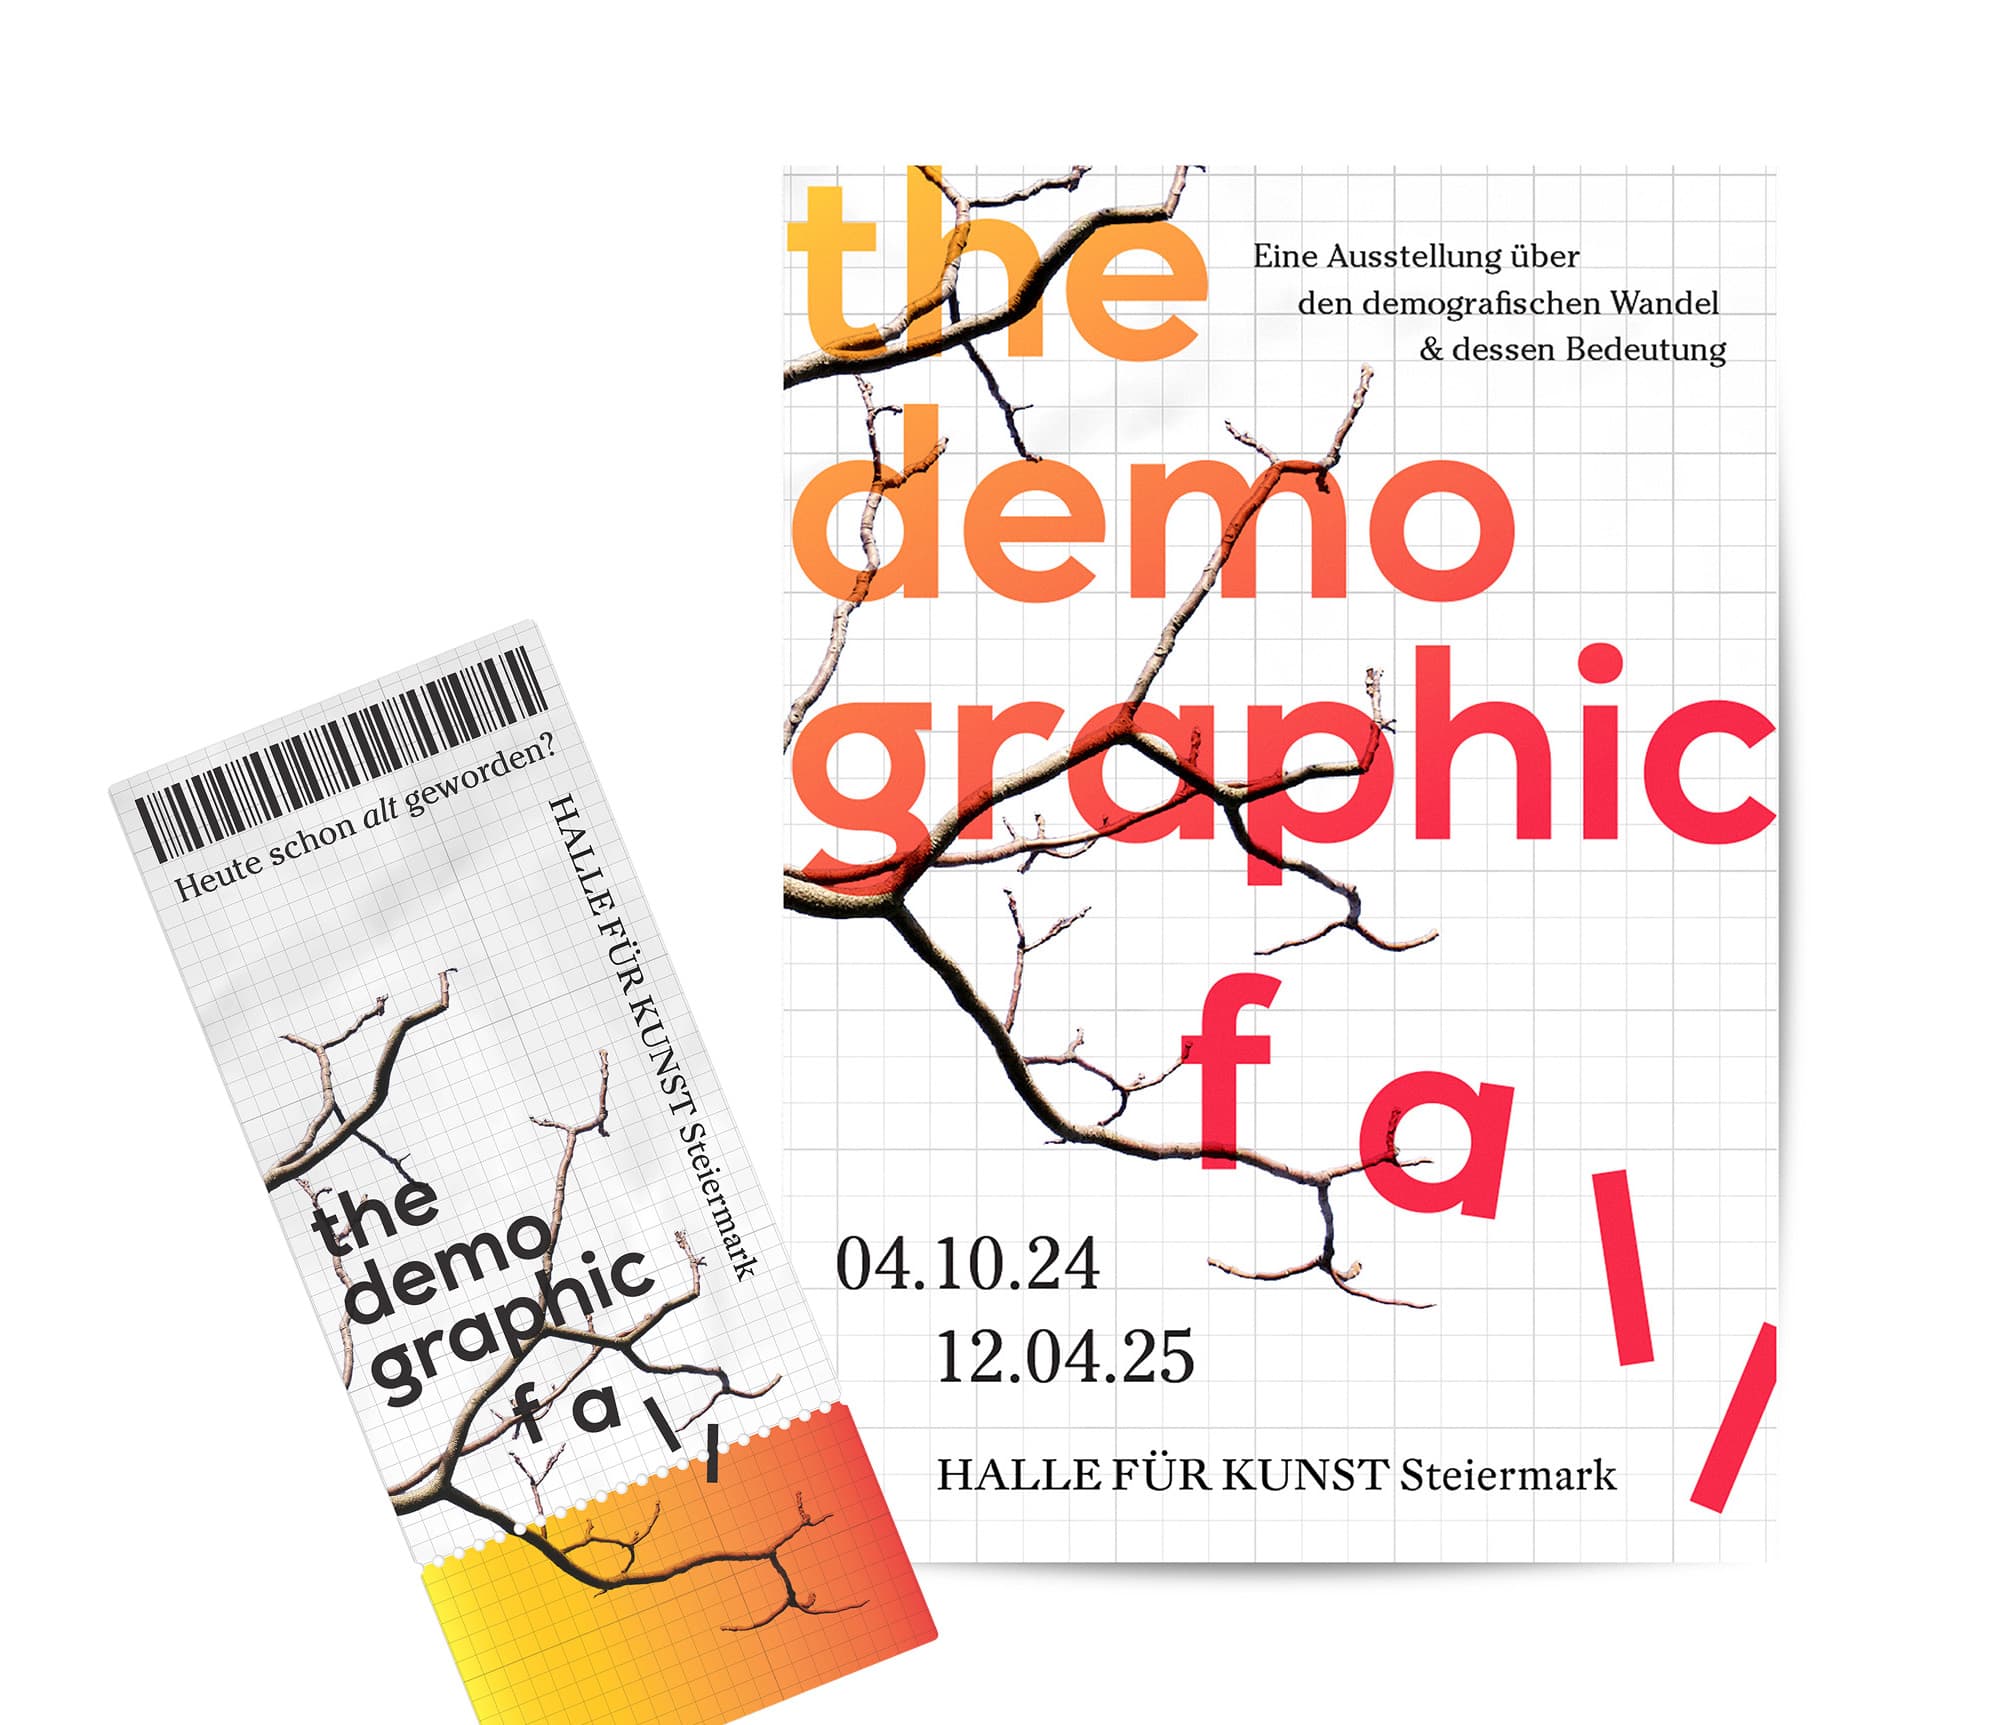
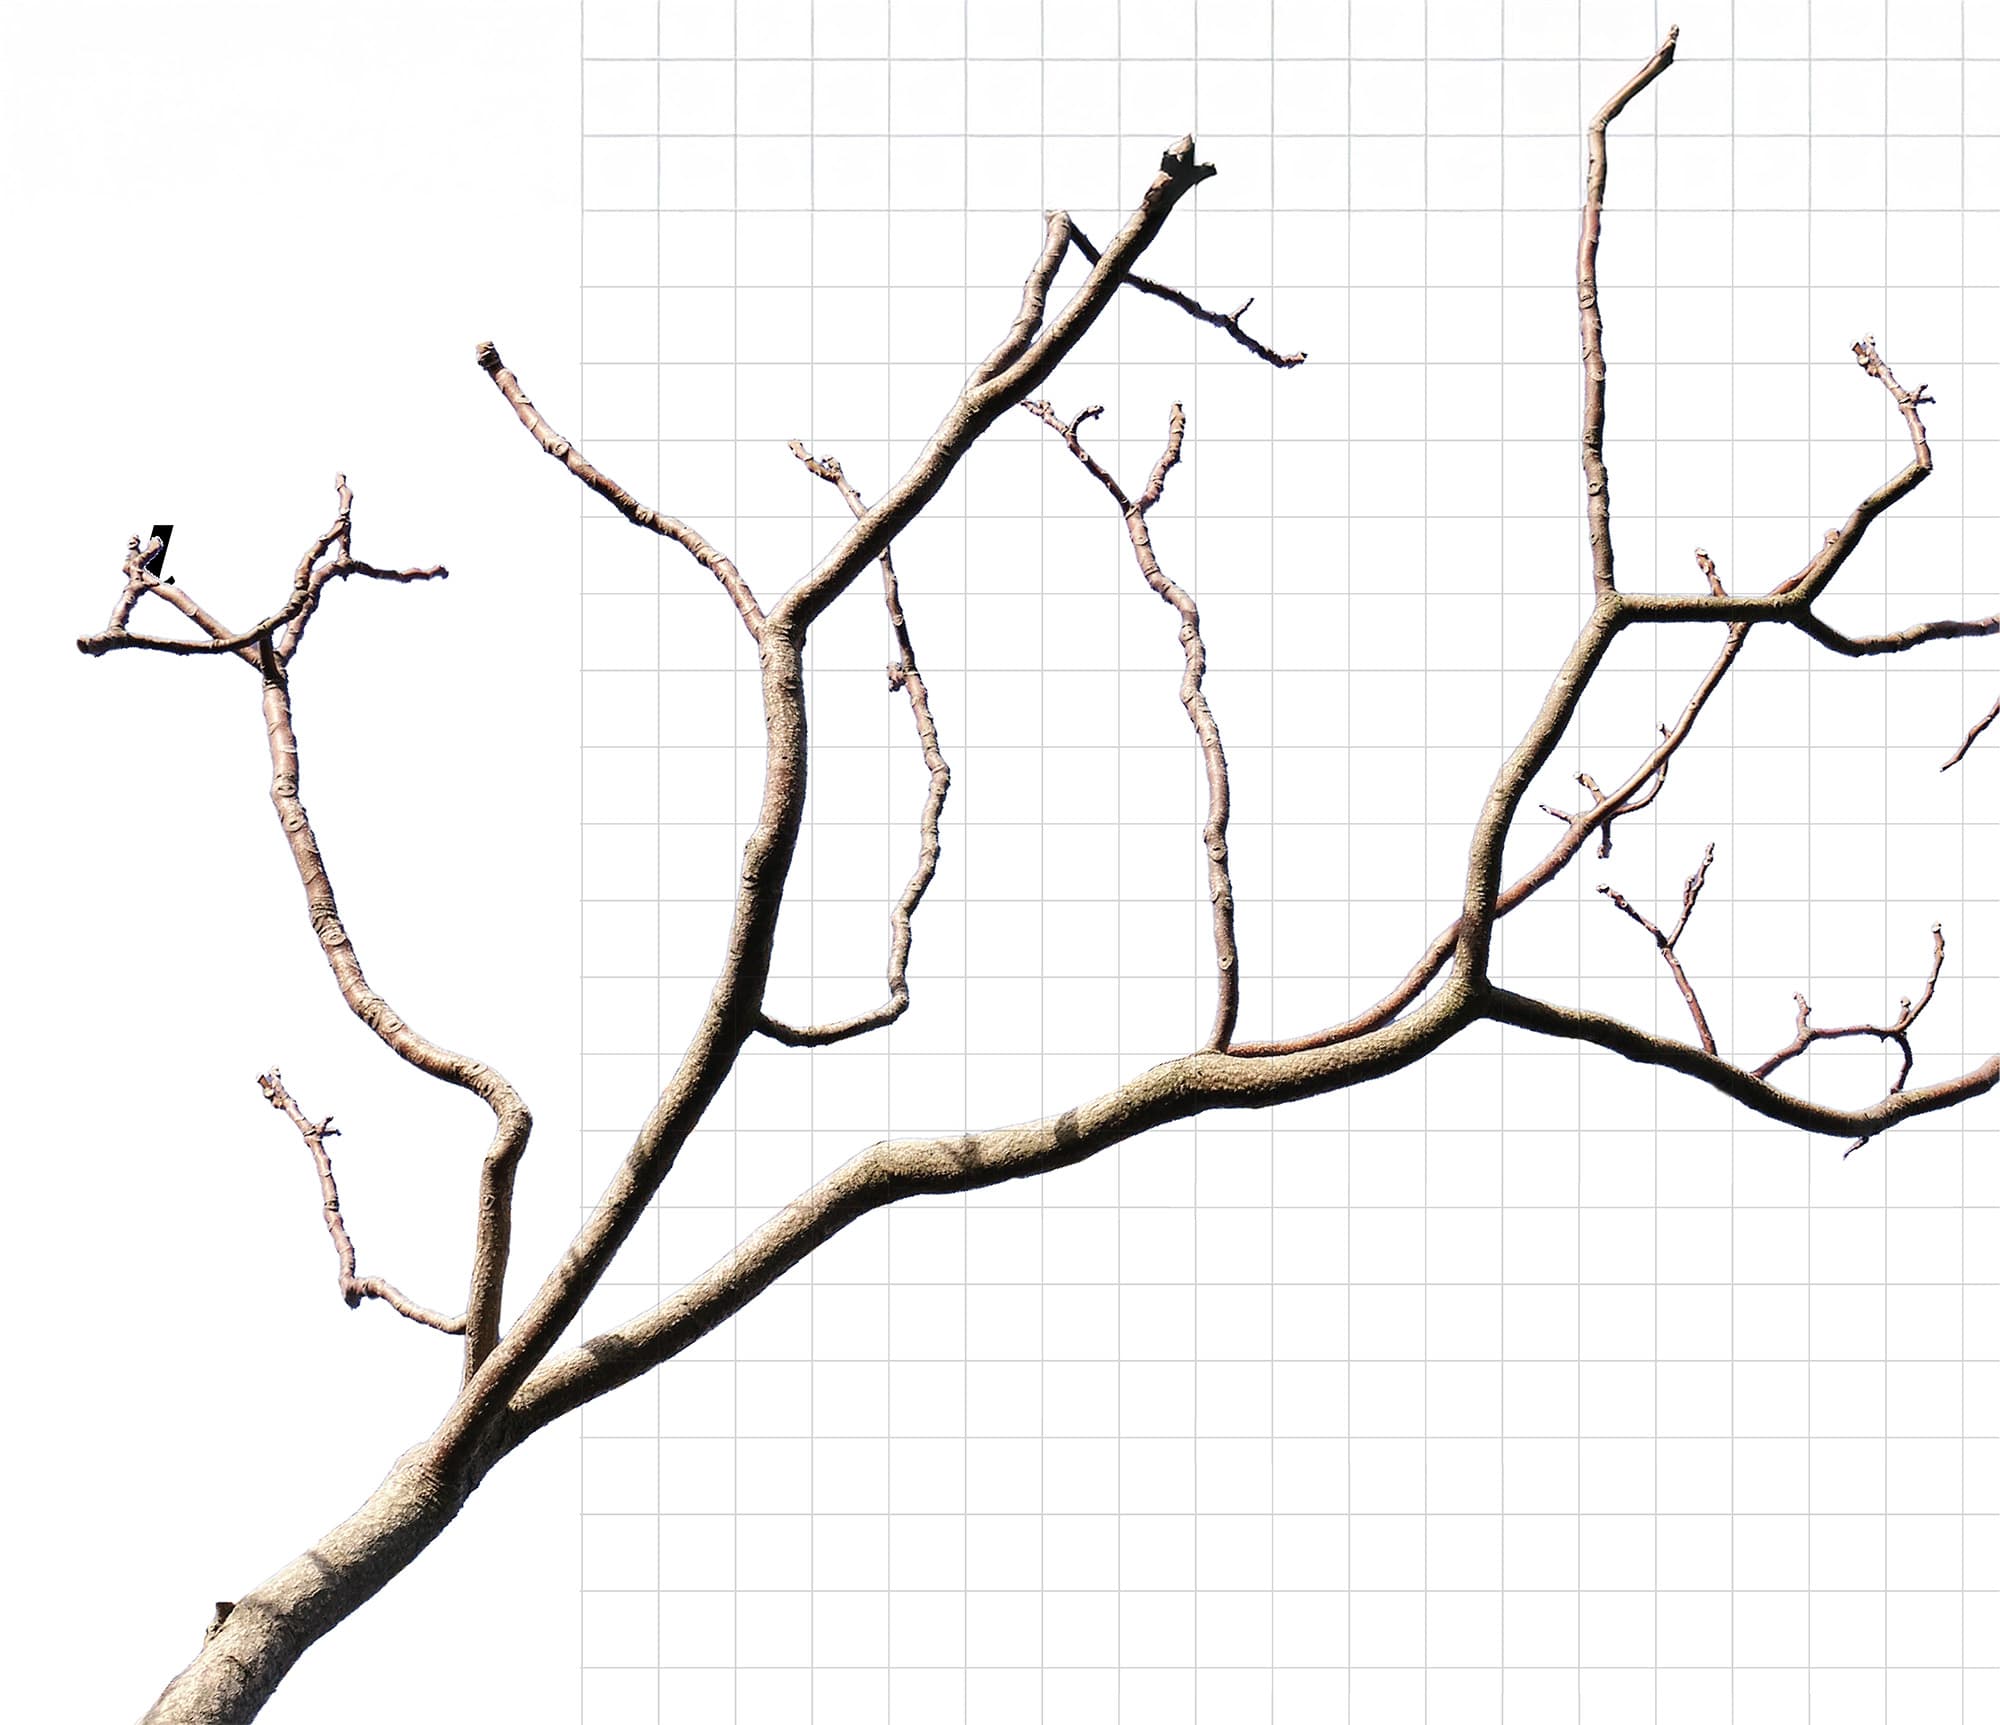
The exhibition uses the image of a growing tree. This image is used to make various demographic processes tangible. In this way, visitors are meant to understand that demographic developments are natural processes.
These natural demographic developments can be observed, recorded, and represented and analyzed as statistics. The statistical character of demography—meaning the representation of societal developments in numbers, graphs, and diagrams—is also visually reflected through a background grid.
Floor plan
Themed spaces
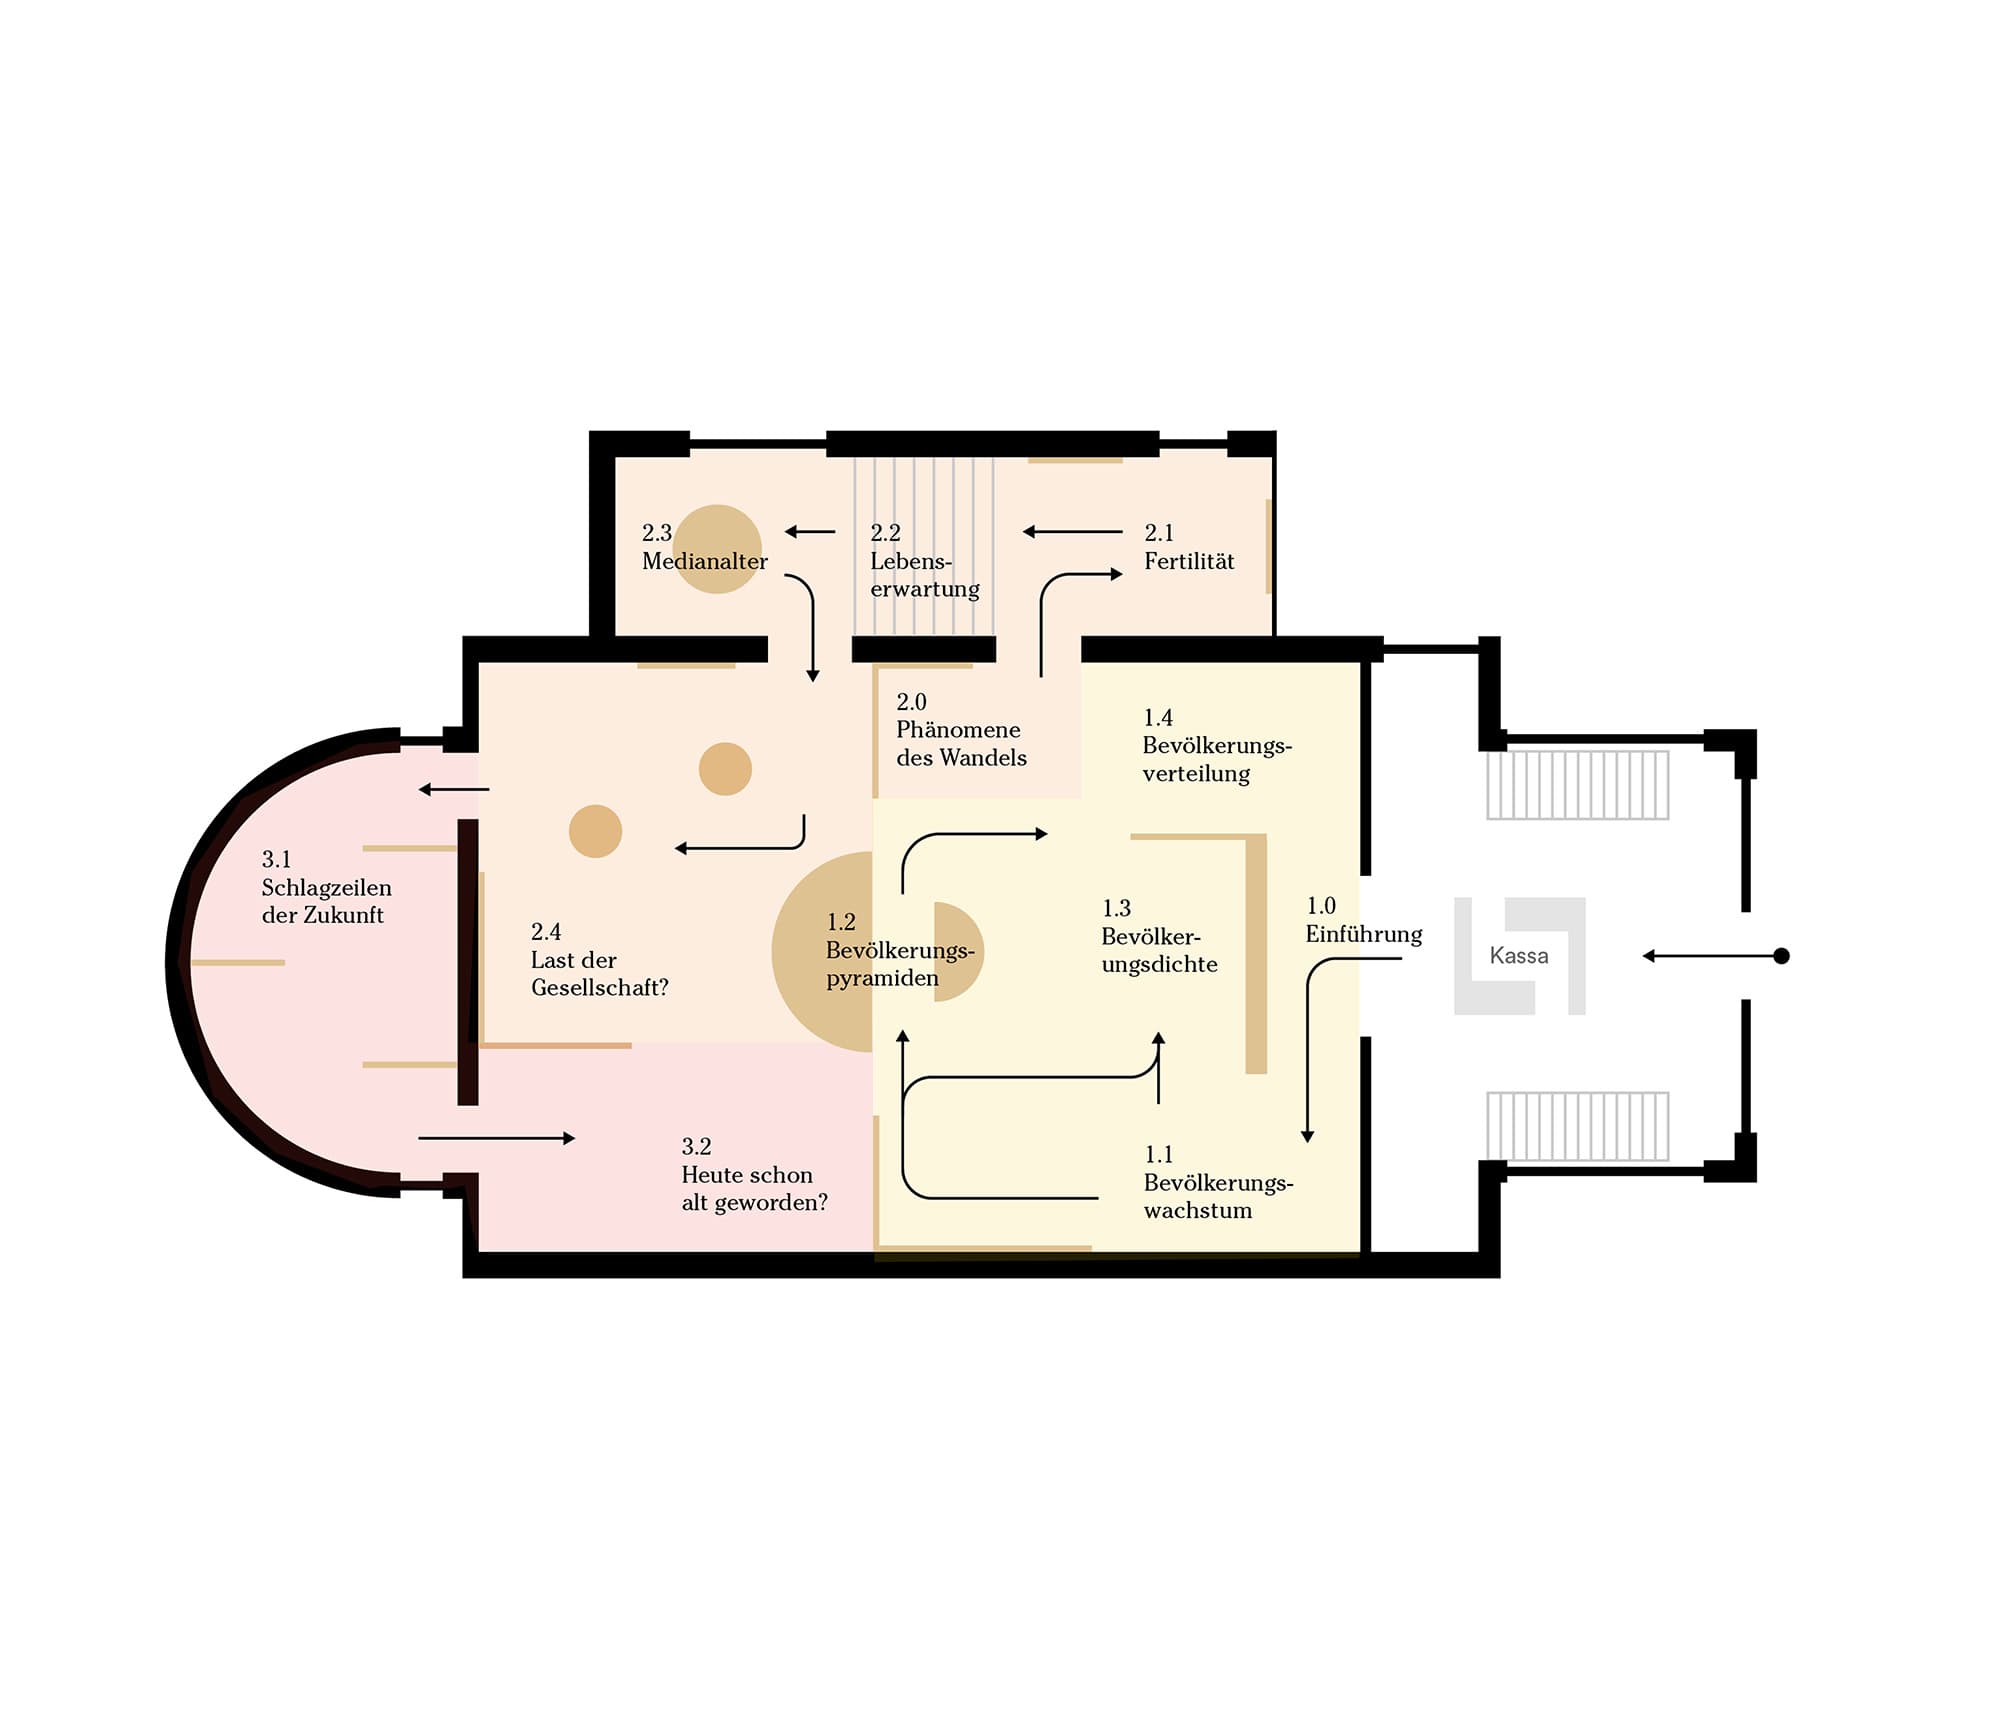
1 – Introduction to Demographics
At the start, visitors are introduced to the topic of demography by being invited to look back at the rapid population growth of the past 200 years. Additionally, population density and the concept of the population pyramid are explained.
2 – Phenomena of Change
The second section focuses on demographic change. First, the two phenomena that contribute to demographic change are examined. This is followed by an exploration of how the demographic shift alters the balance between young and old populations.
3 – Space for speculation
After highlighting the dramatic nature of demographic change, visitors are invited to take a step back and reflect on its resulting societal impacts. Their attention is directed toward an uncertain future as they are presented with various potential future scenarios.
Concept
Encounter demographics
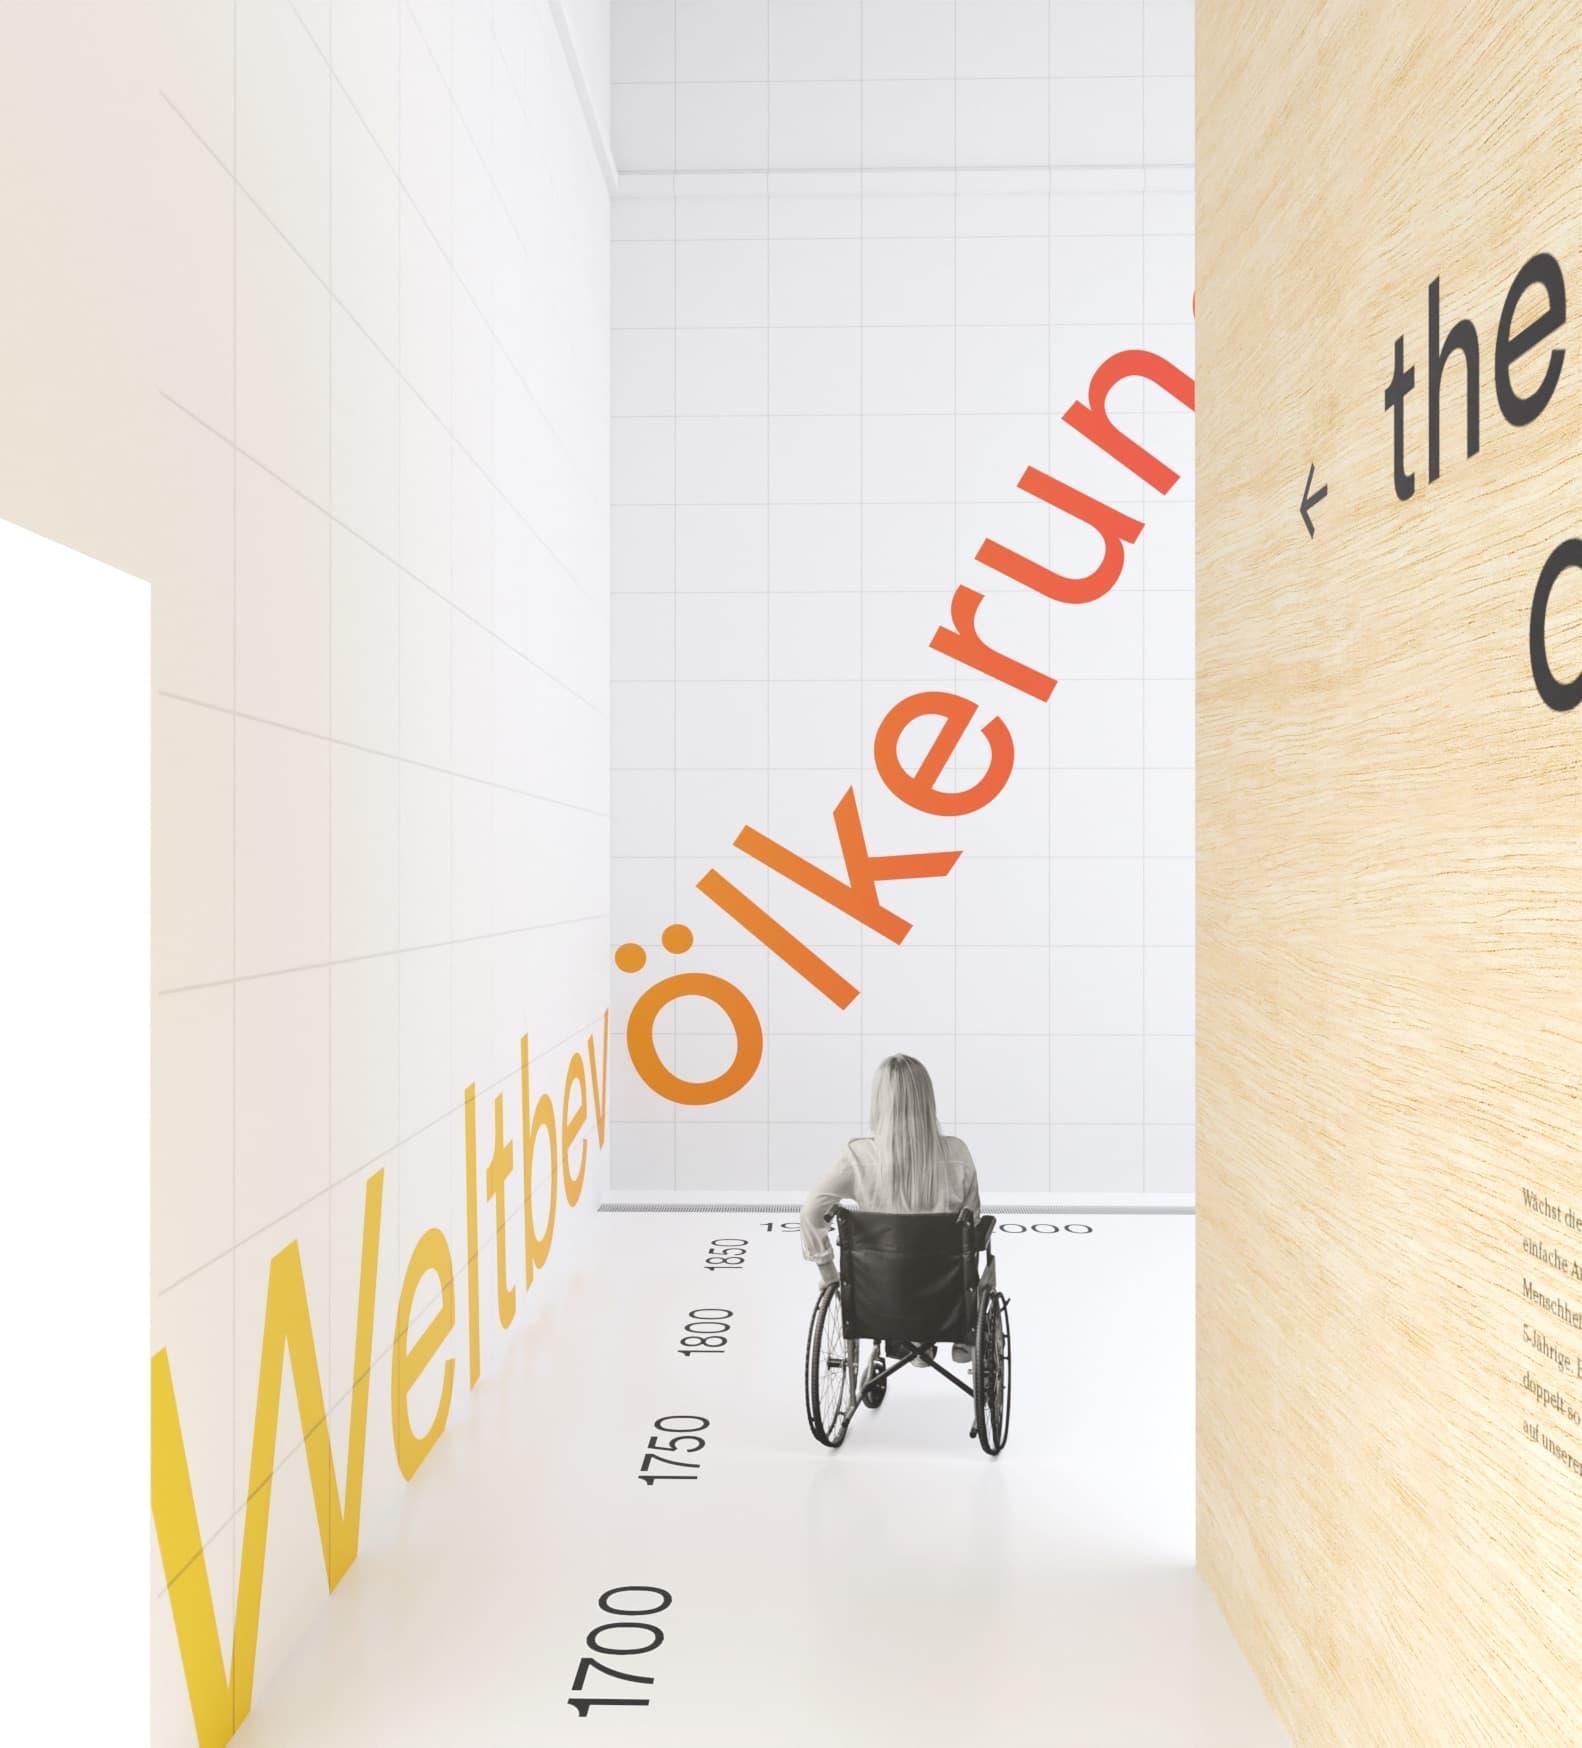
Because the field of demography is largely based on numbers and statistics, it is particularly difficult to make its content and the associated societal consequences tangible. For this reason, the exhibition invites visitors to encounter these numbers and statistics in all spatial dimensions in new ways and to interact with them. For example, rapid population developments are made visually understandable in their (spatial) size or height, or discrepancies in social structures between different countries are shown through (spatial) juxtaposition.
Conceptual Goals:
Understand demography across all spatial dimensions
View statistical numbers from different perspectives
Raise awareness of social consequences and developments
Population growth
Population Pyramids
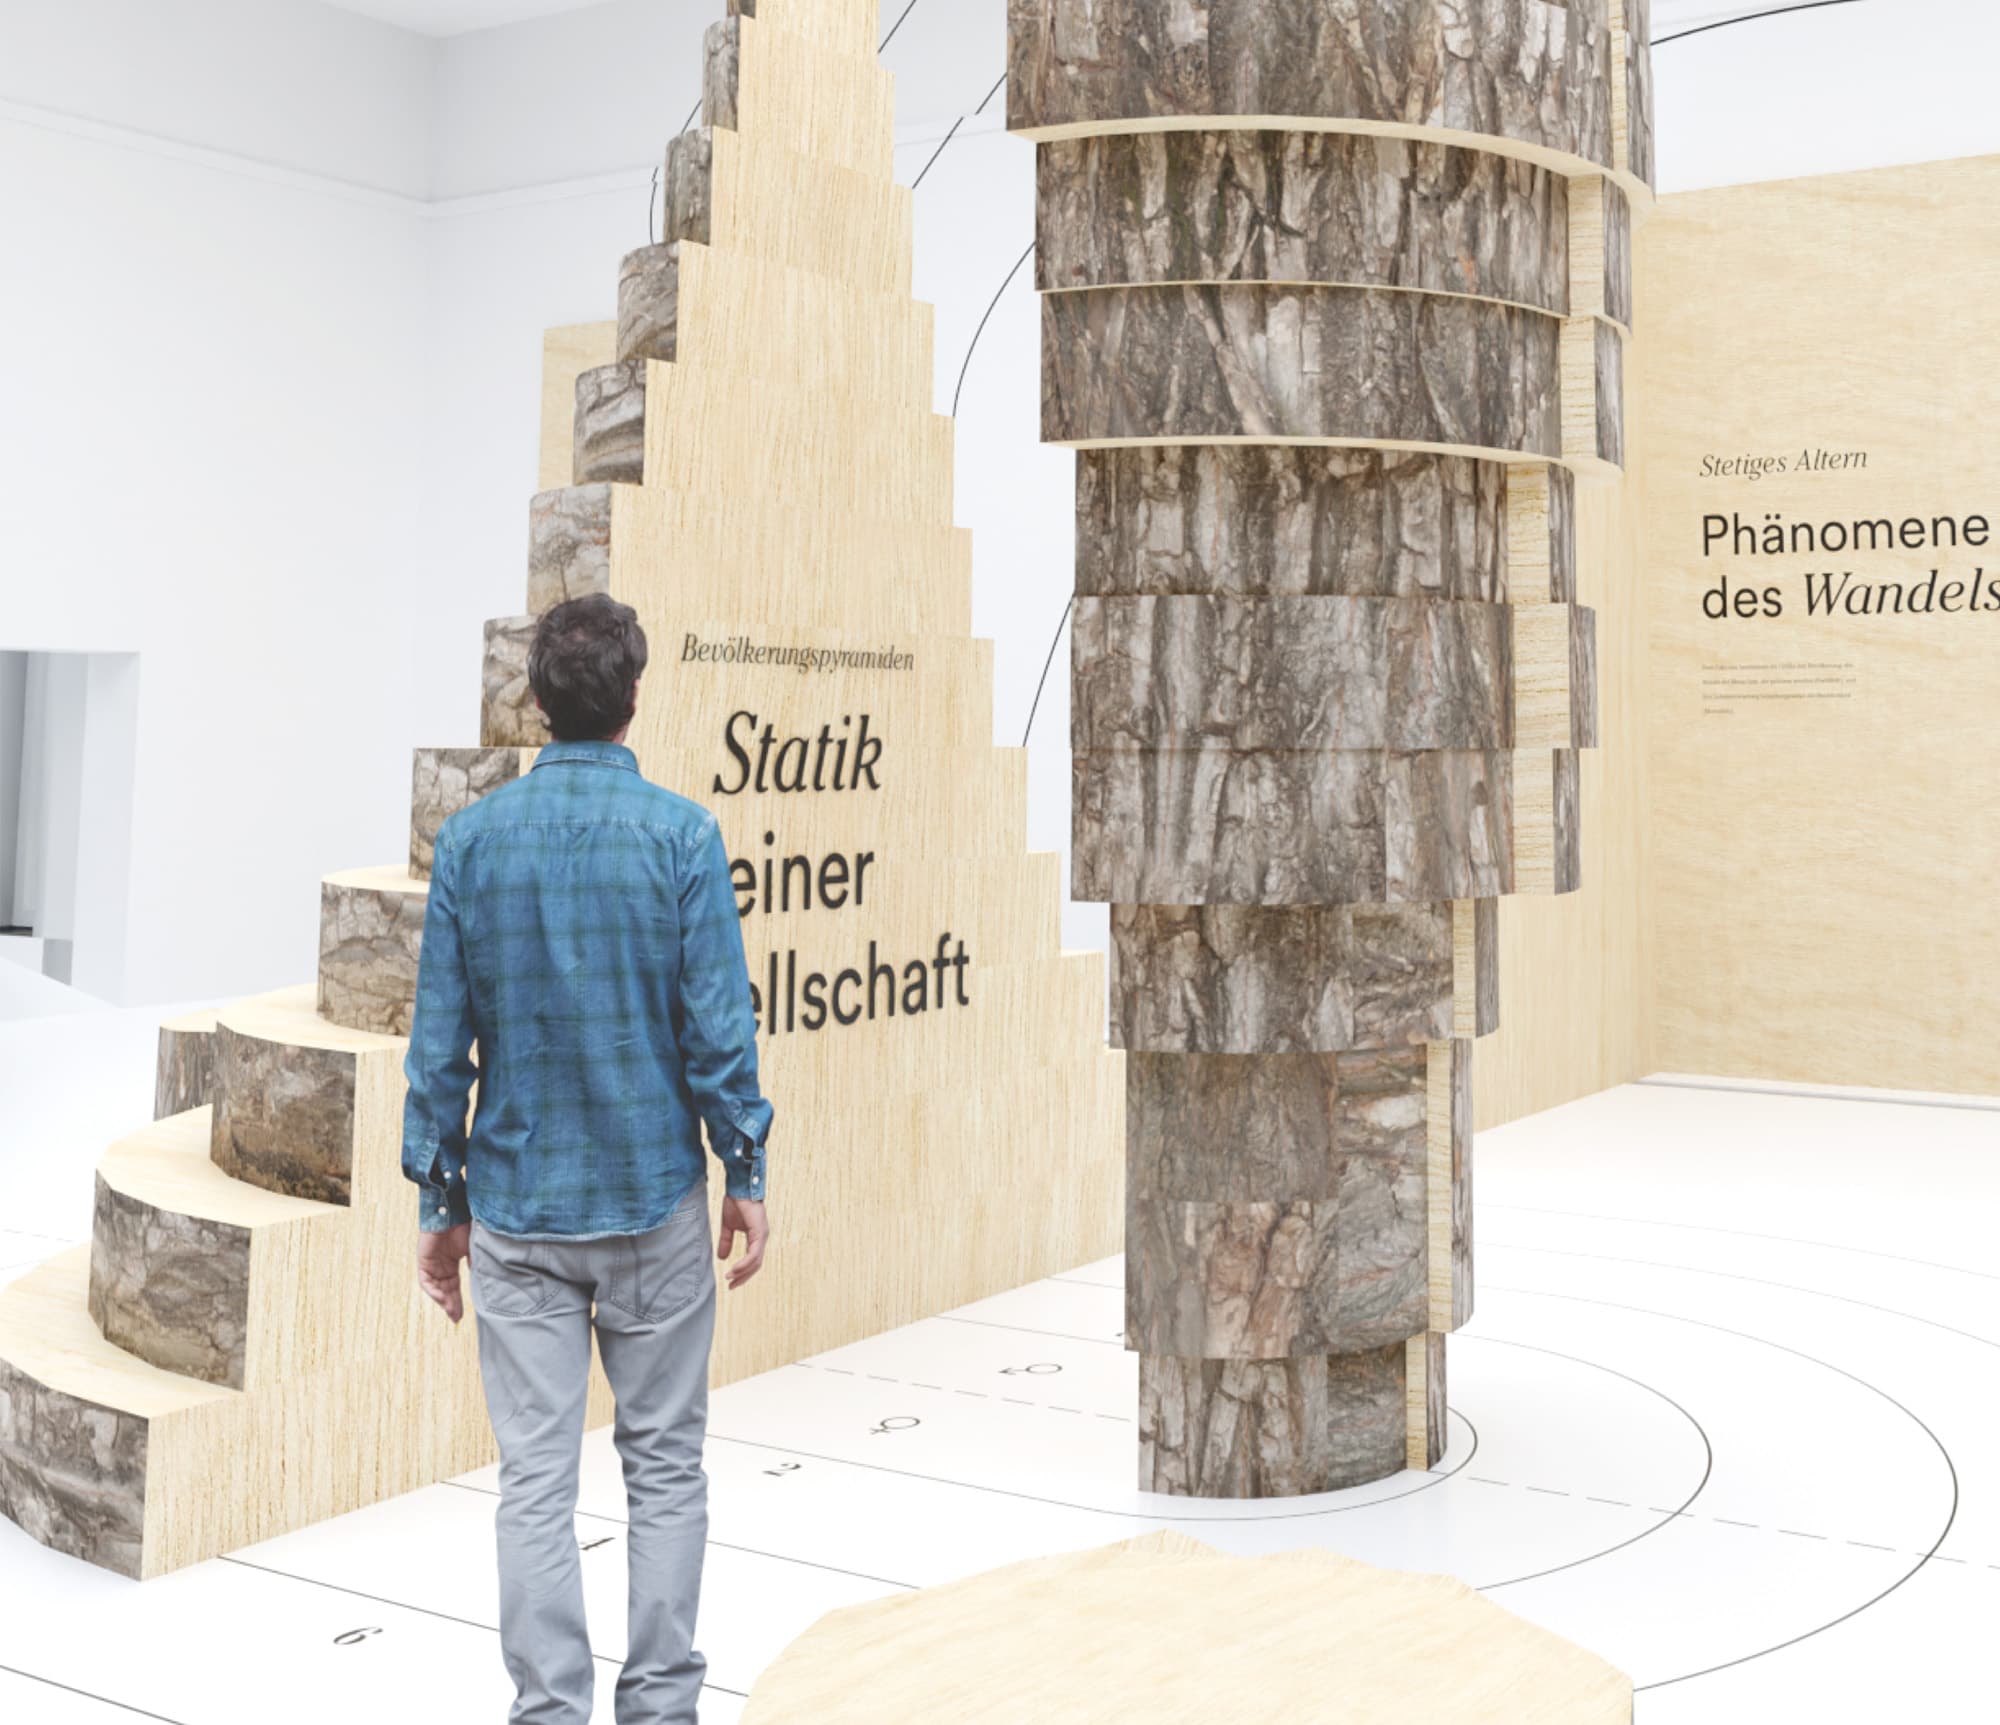
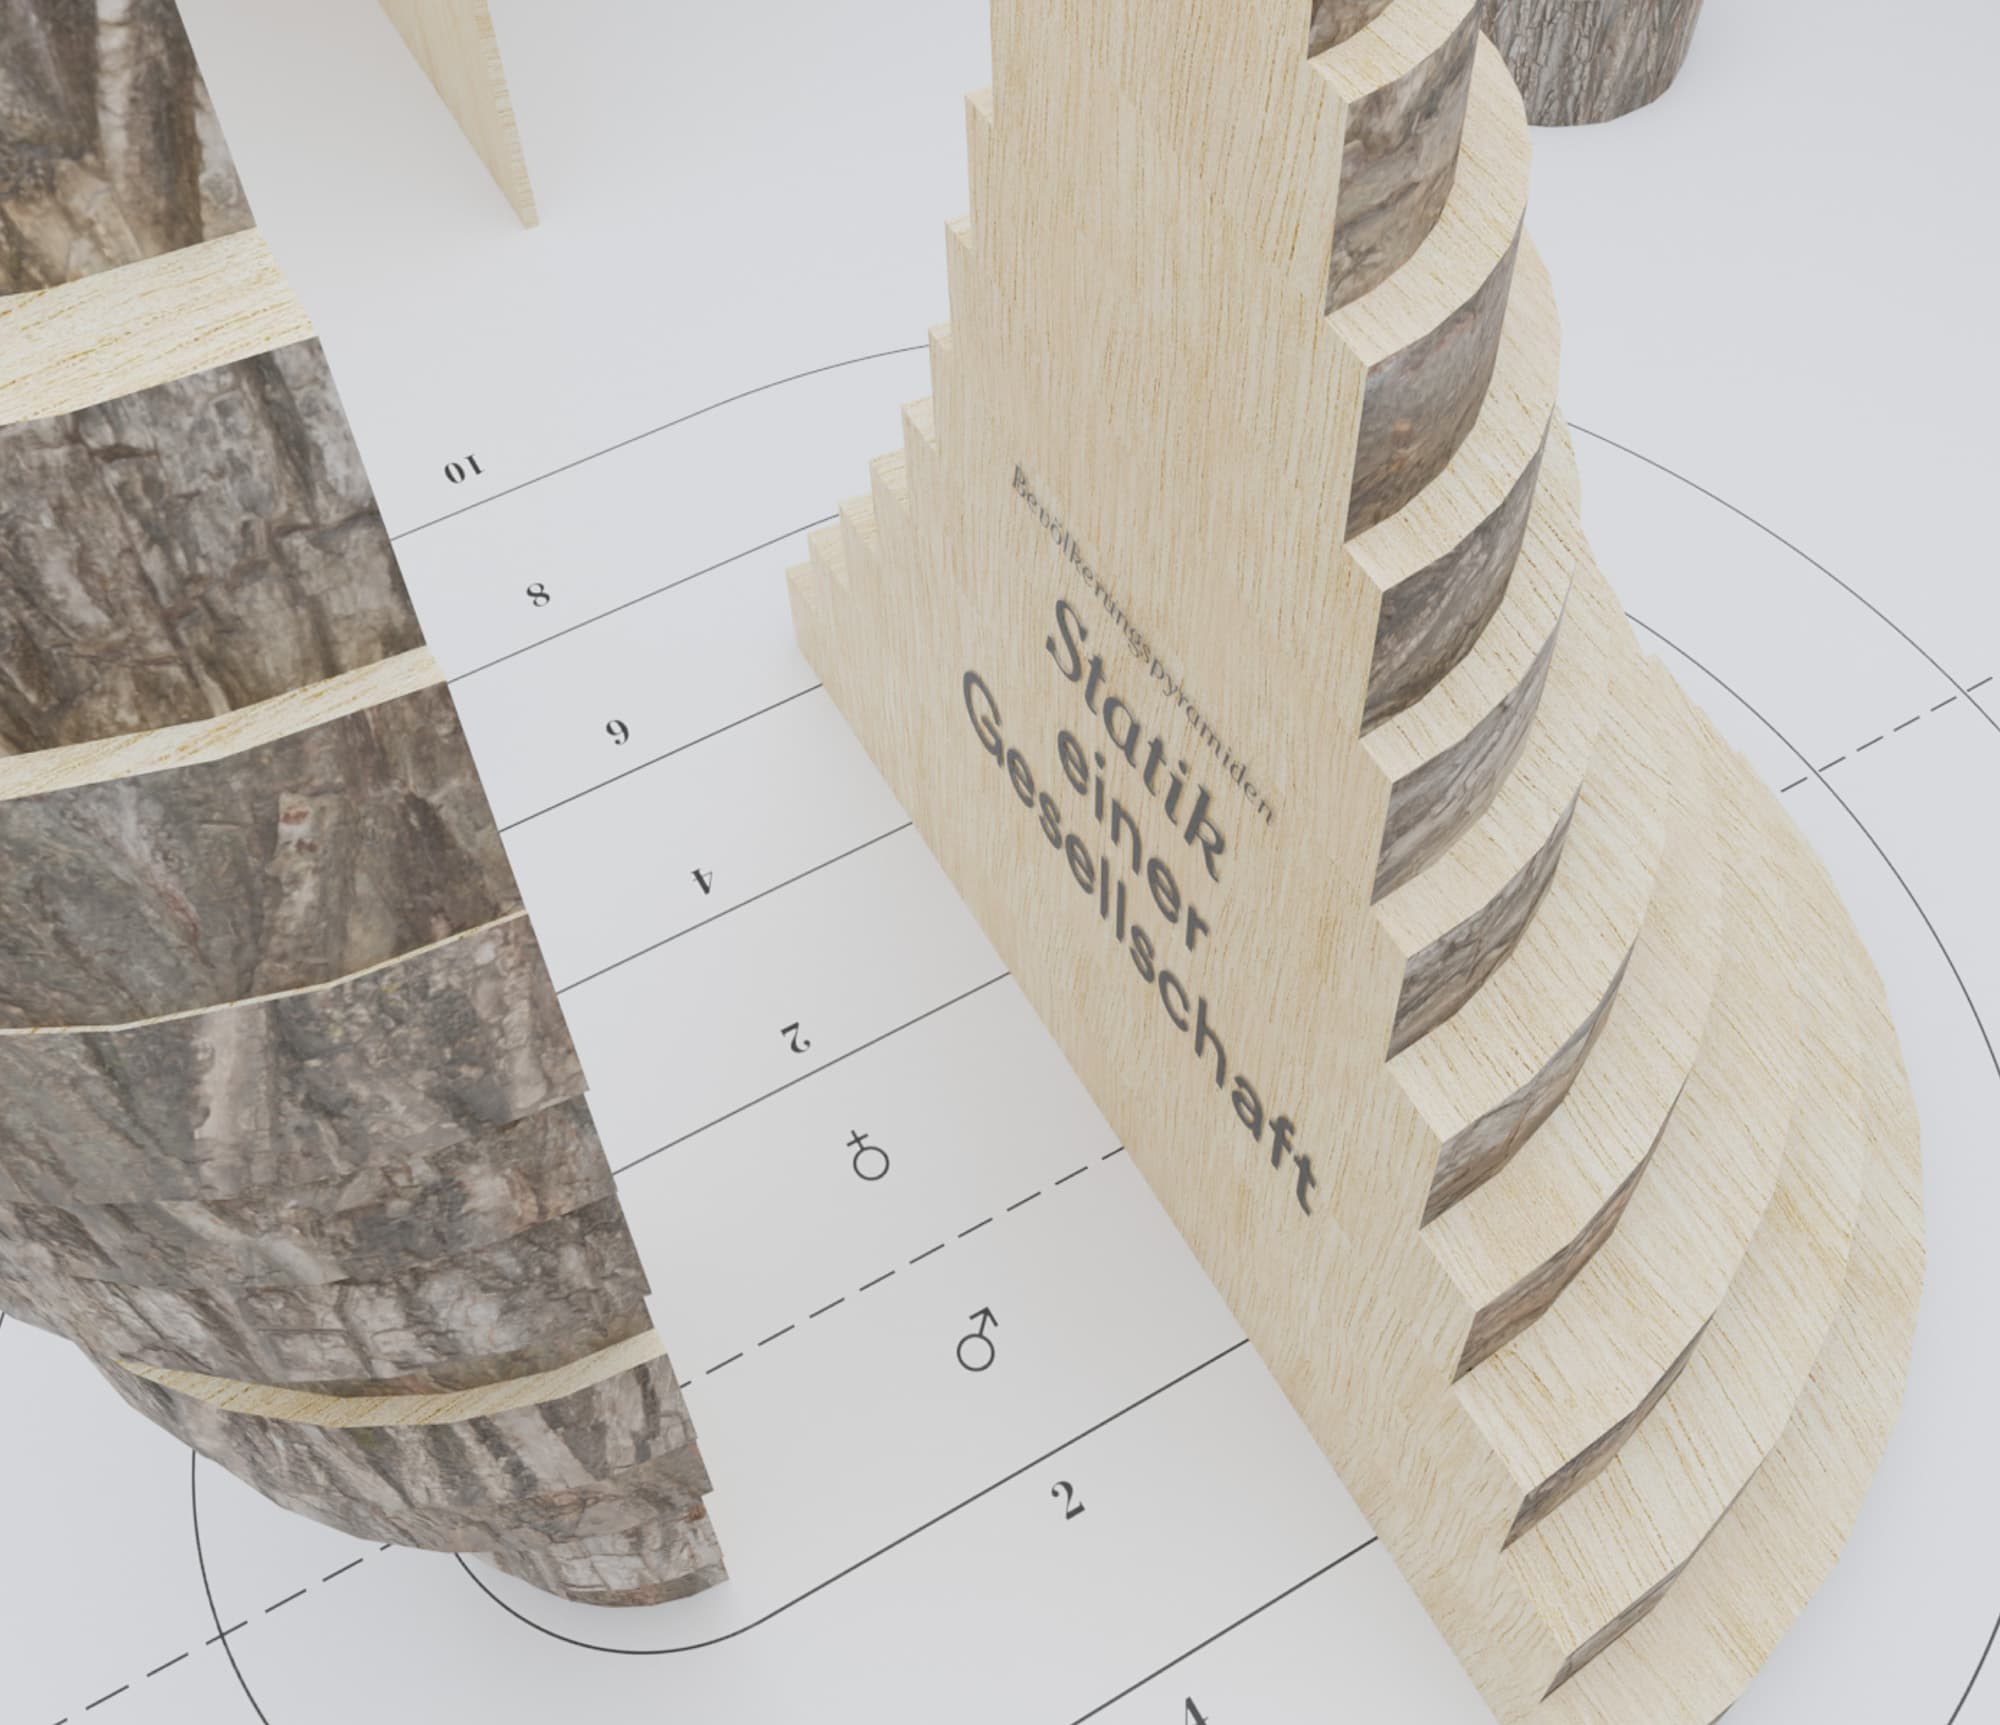
Two opposing cross-sections of the population pyramids of Nigeria and South Korea make the two population structures comparable. Visitors are also invited to touch the objects in order to perceive differences.
Population density
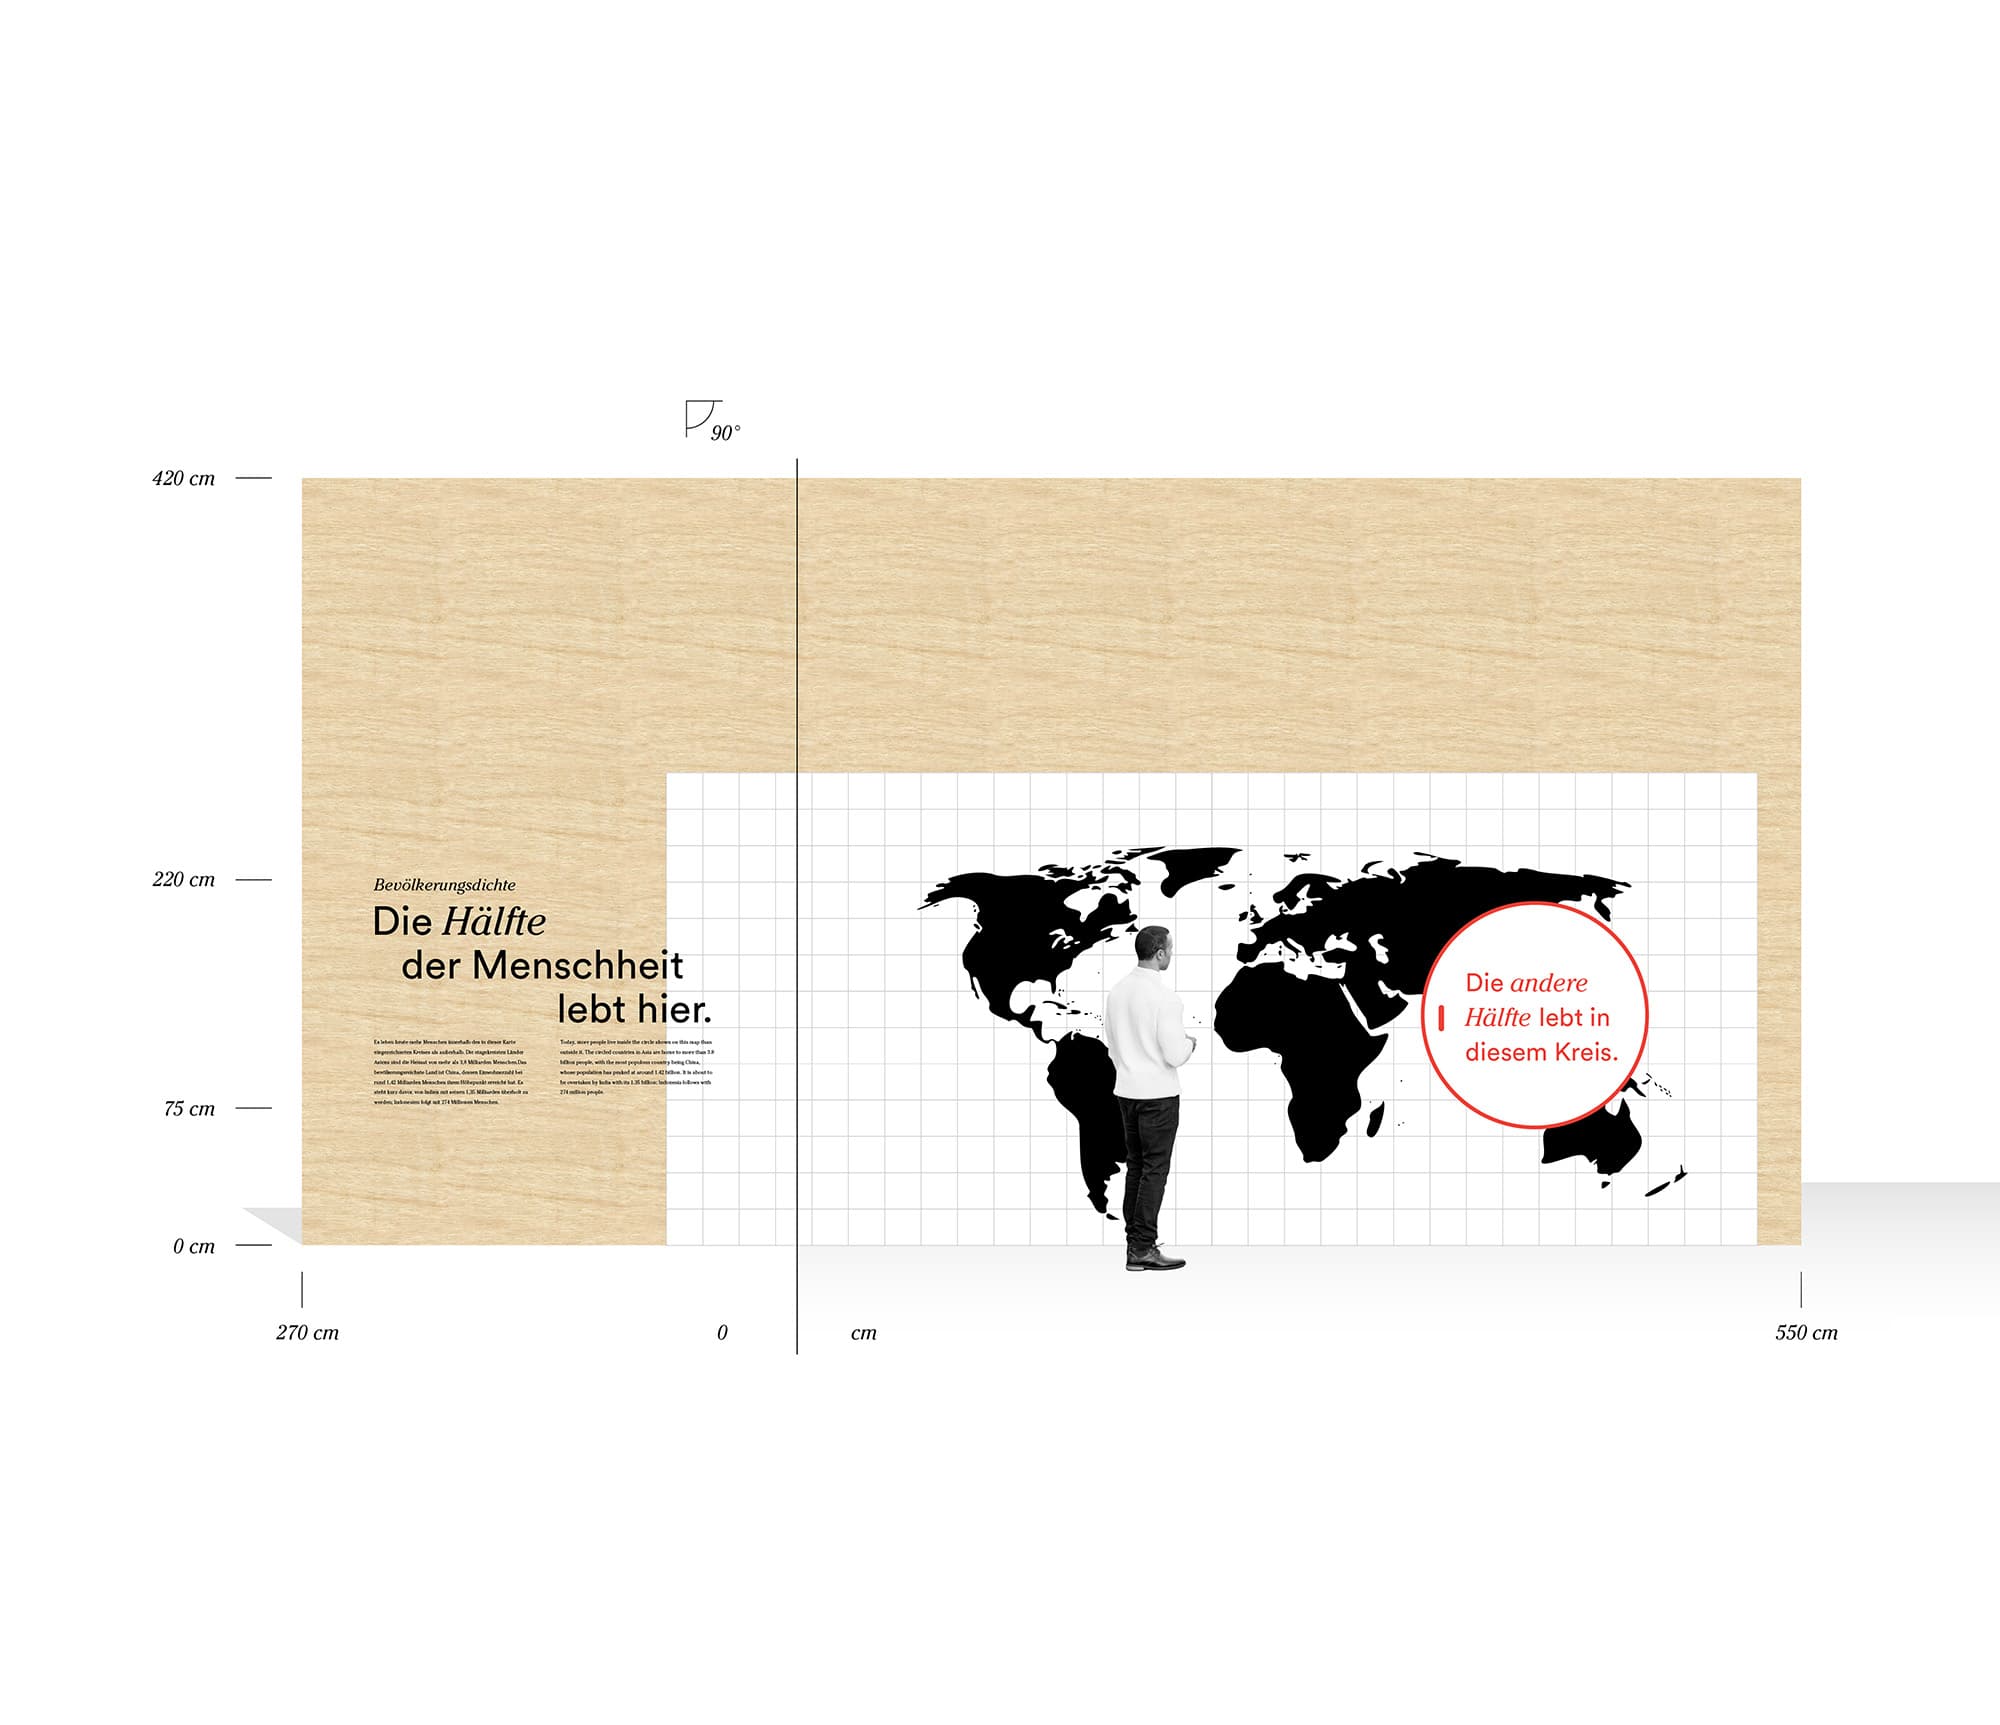
The red circle can be opened using a handle and reveals how confined the space is in which half of the world’s population lives.
Population structure over time
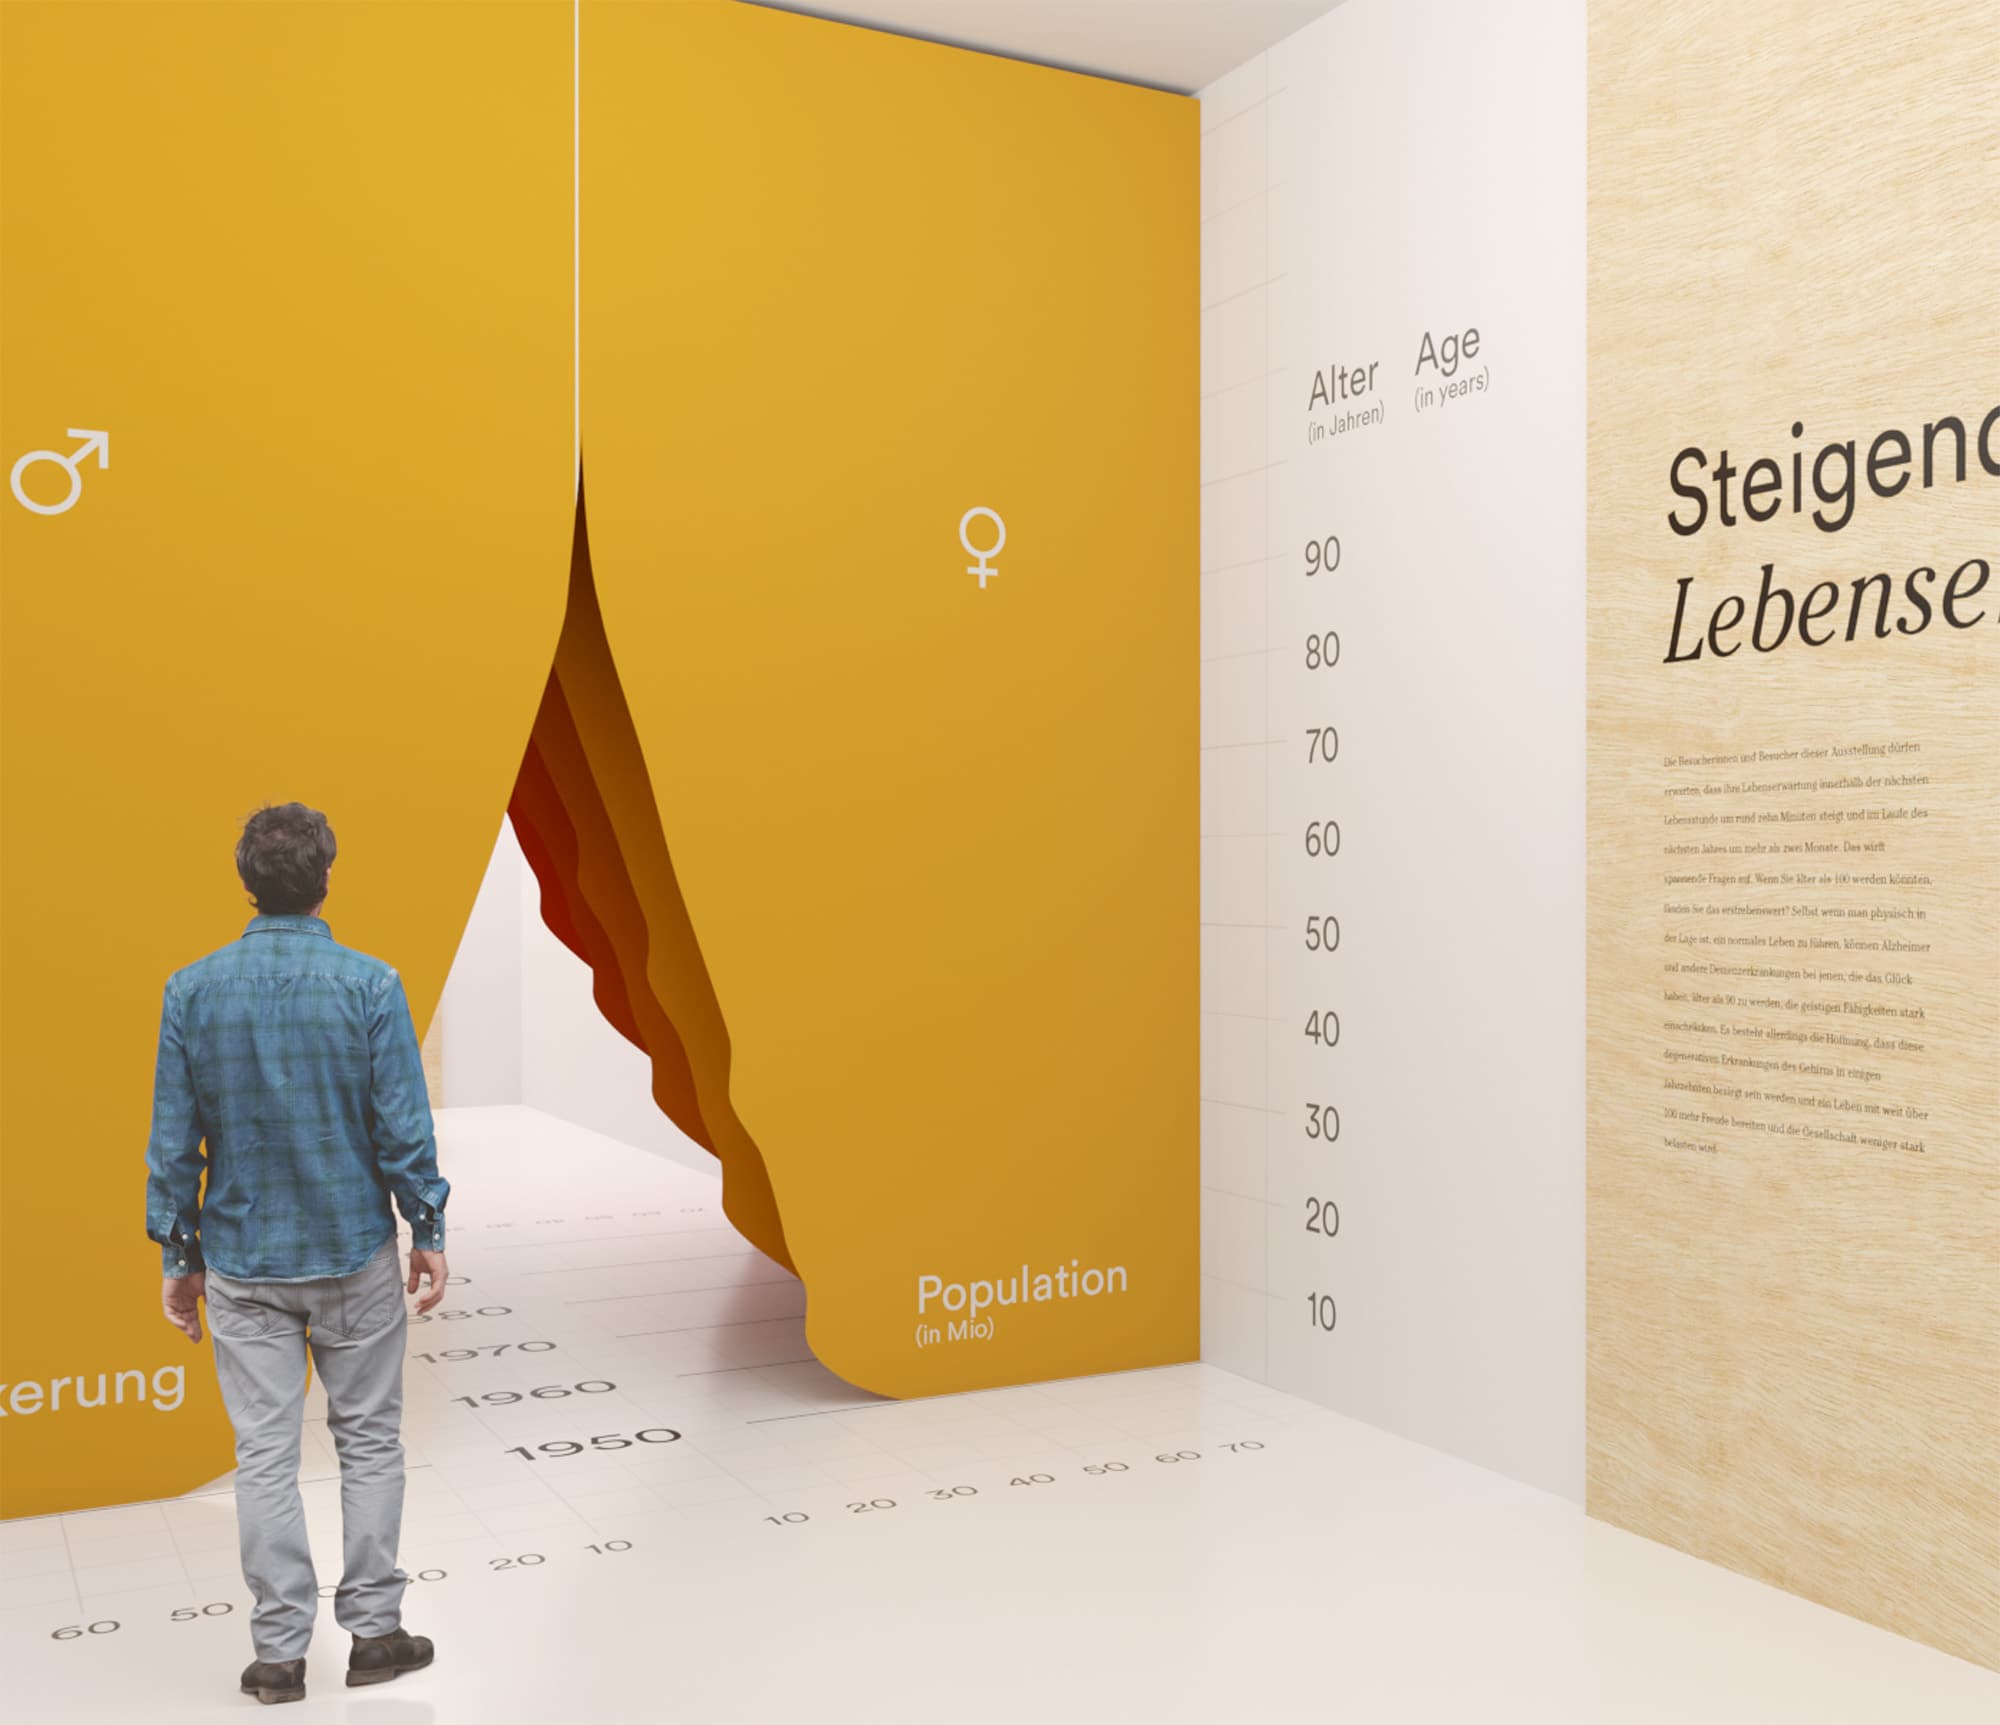
Several textiles hanging one behind the other illustrate demographic change. Visitors can walk through the development of the population structure from 1950 to 2018.
Communication
On growing, blooming, fading & falling
The exhibition primarily communicates externally through posters and flyers. In their design, attention was paid to creating a strong contrast by using bold, vibrant colors on a white background. By interrupting the typography with isolated branches, a disruptive effect is created, which at the same time gives the orange-red typeface the character of autumn leaves. This visual element is taken up again in the way the exhibition title appears to gradually fall down from the crown of the tree.